MLPKriging::predict
Description
Predict the mean (and optionally standard deviation / covariance) from an MLPKriging model.
Usage
Python
# mk = MLPKriging(...)
mk.predict(x, return_stdev = True, return_cov = False, return_deriv = False)
R
# mk <- MLPKriging(...)
mk$predict(x, return_stdev = TRUE, return_cov = FALSE, return_deriv = FALSE)
Julia
# mk = MLPKriging(...)
p = predict(mk, x, return_stdev=true, return_cov=false, return_deriv=false)
println(p.mean)
println(p.stdev)
Arguments
Argument |
Description |
|---|---|
|
Numeric matrix of prediction points (\(m \times d\)). |
|
Logical. If |
|
Logical. If |
|
Logical. If |
Value
A list with:
mean— numeric vector of posterior mean values atx.stdev— (ifreturn_stdev = TRUE) numeric vector of posterior standard deviations.cov— (ifreturn_cov = TRUE) posterior covariance matrix.mean_deriv,stdev_deriv— (ifreturn_deriv = TRUE) derivative matrices.
Examples
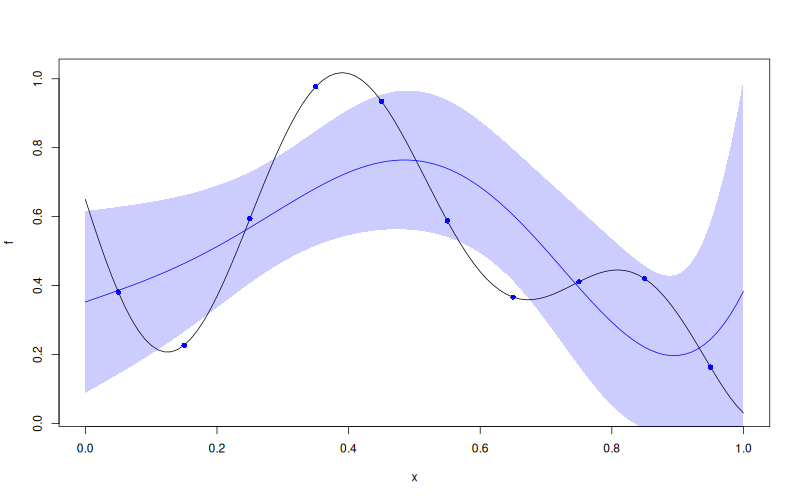
f <- function(x) 1 - 1 / 2 * (sin(12 * x) / (1 + x) + 2 * cos(7 * x) * x^5 + 0.7)
X <- as.matrix(seq(0.05, 0.95, length.out = 10))
y <- f(X)

mk <- MLPKriging(
  y, X,
  hidden_dims = c(4L),
  d_out = 1L,
  activation = "tanh",
  kernel = "gauss",
  parameters = list(max_iter_adam = "20", max_iter_bfgs = "10")
)
x <- as.matrix(seq(0, 1, length.out = 101))
p <- mk$predict(x, return_stdev = TRUE)

plot(f)
points(X, y, col = "blue", pch = 16)
lines(x, p$mean, col = "blue")
polygon(c(x, rev(x)), c(p$mean - 2 * p$stdev, rev(p$mean + 2 * p$stdev)),
        border = NA, col = rgb(0, 0, 1, 0.2))
Results